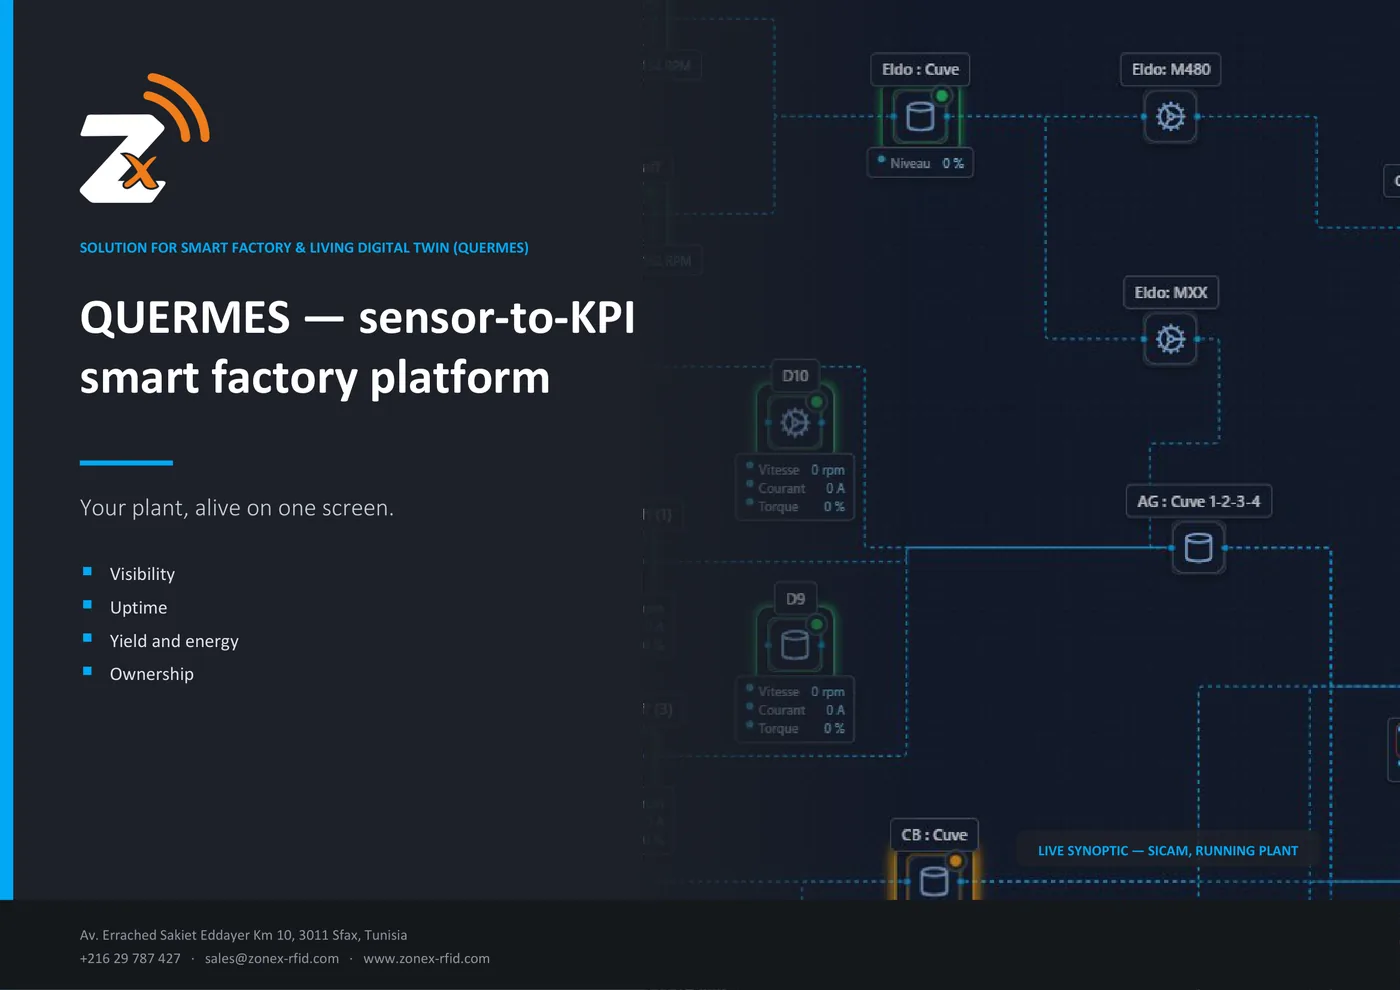
Your plant, alive on one screen. Your plant, alive on one screen — from the first sensor to the final KPI.
Your plant, alive on one screen — from the first sensor to the final KPI.
Who this is for : Plant managers, automation and process engineering managers, industrial IT / OT leaders, energy and maintenance managers, digital-transformation directors.
THE PROBLEM
PLCs, power meters and drives each hold their own truth. None of it is comparable, and none of it leaves the machine.
There is no single view of what every line and machine is doing right now — only screens per area and spreadsheets per shift.
Downtime, drifting yield and energy waste are discovered after they have already cost you.
You know the material yield dropped. You cannot see where in the process it went.
One machine stops and the line follows, but nothing shows the chain reaction, so the team fixes symptoms.
Adding a machine, a variable or a user means a ticket, a quote and a wait.
KEY FEATURES
Draw your plant once in the synoptic editor — no code. Link each node to a real machine and it lights up live: running, data ageing, down, alarm. Plus a true-to-scale plan de masse.
Modbus drives, Schneider power meters, Siemens PLCs (ET200S/SP) and more, unified over a dedicated MQTT backbone.
Brand → Vectors → Variables. Set units, scaling and sampling in the UI. A new variable on a machine, and the twin follows automatically.
Live OEE, line status, cadence, output per shift, energy per tonne and active alarms — one screen, built for the wall display and for the manager's phone.
Live Sankey diagrams from raw input to finished product, with material yield tracked in real time and flagged the instant it drops below target.
Threshold and status alarms per variable, plus a cascade view showing how one stoppage ripples downstream — so you fix the cause.
HOW IT WORKS
WHAT YOU GET
| Visibility | The whole plant, live, on one screen — the same numbers for everyone. |
|---|---|
| Uptime | Faster reaction, fewer surprises, root cause instead of symptom. |
| Yield and energy | Waste made visible the moment it happens, not at month end. |
| Ownership | Your engineers change the model in the app, in minutes. |
Proof in production : Deployed at SICAM — a tomato-processing operation running concentrate and peeled lines (L1 / L2), sertisseuses, pasteurisers, evaporators, tunnels and boilers, with material-flow yield and OEE tracked in real time.
WHY ZONEX
| A living twin, not a dashboard | The plant model itself carries the live status. |
|---|---|
| No-code device modelling | Connect and configure without a project every time. |
| Sensor to KPI in one platform | Acquisition, twin, analytics, alerts, traceability and mobile. |
| Built for the millisecond and the multi-site | React + Node real-time services, MongoDB, high-rate time-series, MQTT. |
| RFID companion | ZoneX RFID mobile for on-the-floor asset tracking, enrolment and inventory. |